

iLAB is based on two management theories and ideas: (1) decision sciences and operations management (DSOM) and (2) business analytics. iLAB prescribes a method of developing the lab designs using DSOM principles. Once the physical infrastructure has been planned to support efficient, lean and flexible operations using DSOM, iLAB dashboard is developed using business analytics principles and IIoT (Industrial Internet of Things) based tools.
Why Do We Need iLAB?
Laboratories are an integral part of the pharmaceutical industry. They are used at each stage of the product development:
- Research and development of a new drug molecule, medical device, etc.
- Testing of samples generated during clinical trials, to confirm safety and efficacy.
- Quality testing at various stages of production as well as at the end of the production cycle.
iLAB was developed to address the following recurring challenges that pharmaceutical labs face:
Capital Planning Challenge
Depending on the specific function a lab is performing, labs can be as small as 2% of the overall facility size to as large as 80-85% of the facility size. Whether a lab is operating efficiently or not can have a significant impact on a company’s total operating costs. At low end, the lab construction is at $250/SF. If we add the cost of researchers, lab equipment, rent and other standard operating expenses, the cost of running a lab can easily add up to $1,000/SF/year.
Unlike the production spaces where automation is used to optimize equipment and space utilization, most labs don’t track actual utilization of all of the resources cohesively. LIMS do not connect every single piece of equipment, bench utilization is not tracked and research staff utilization is not measured in a very meaningful way. As a result, when a new project comes along, capital planning is based on perception of utilization effectiveness vs. a real set of data.
This uncertainty leads to poor project planning where nobody is quite certain whether the current labs have spare capacity to support a new project or it is truly over-utilized to a point of diminishing returns.
Operations and Management Concerns
Lack of resource utilization tracking leads to poor management of assets. Equipment sits idle, lab benches may be collecting dust and storage units are filled with stuff. All of these assets utilize space, leading to capital loss for the company.
Not only are the idle equipment and overfilled shelves occupying expensive real estate, it cannot be easy to function well in such environments. This indirectly leads to waste of valuable research time. Ultimately, it translates into capital loss.
iLAB was developed as a method and product offering to mitigate these concerns.
What Is iLAB?
iLAB: Intelligent Lean Lab is a product + process solution that uses modern design principles, construction technology and Industrial Internet of Things (IIoT). As a product, it is a virtual replica of the physical lab, in infrastructure as well as in operation. As a process, it prescribes lab design using LEAN and FLEX principles. It can be defined as follows:
It uses modern lab design principles
- Based on Decision Science and Operations Management (DSOM) principles
- Maximizes efficiency and resource utilization
- Supports global supply chain and fluctuating business conditions
It is a digital platform
- Based on the principles of Business Analytics and Statistics. These concepts aim to organize data for easy visualization. The focus of business analytics is to understand patterns, discern outliers and assess co-relations.
- The key concern of business analytics is to present the data in a meaningful way that removes irrelevant data, informatics and graphics as they are distractions. Ultimately, the data needs to be presented in a simple, visual fashion that aids in intelligent decision making.
- Using these principles, iLAB dashboard is organized such that all lab systems and components are digitally connected including benches, instruments, staff and schedule.
It is a dynamic business partner
- Enables informed business decision making (short and long term)
- Custom platform unique to each company
- Can integrate labs across the world for a single company.
iLAB: The Process
iLAB: Intelligent Lean Lab is designed using decision sciences based thought process. Following steps are prescribed for developing an iLAB.
STEP 1 Lean Lab thru Process Informed Design

The design process is linear as outlined in the following steps and flow diagram.
- Outline the flow of samples, personnel or activities through the facility.
- Establish the most efficient adjacencies.
- Create a transitioning diagram at facility level.
- Create a block diagram at facility level.
- Create process mapping at each lab level.
- Create lab layout to support the most efficient process execution.
STEP 2 Housekeeping and Workplace Optimization with 5S
The optimization process is linear as outlined in the following steps and flow diagram.
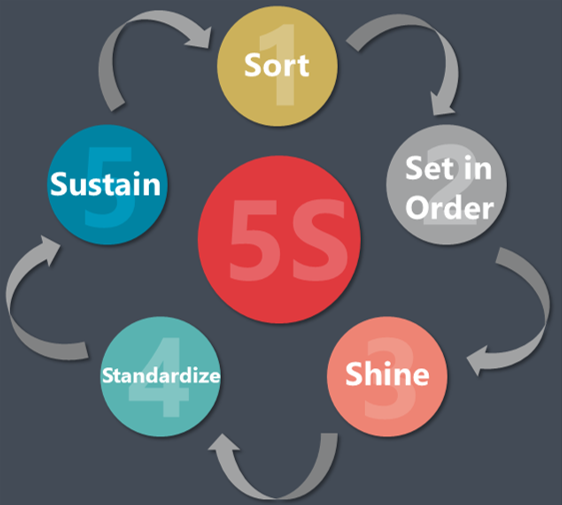
- Sorting through all items in a location, removing all unnecessary items.
- Putting all necessary items in the optimal place for fulfilling their function in the workplace.
- Cleaning and inspecting the workplace, tools and machinery on a regular basis.
- Standardize the processes used to sort, order and clean the workplace
- Sustain the developed processes by self-discipline of the workers. Dedicated staff to sustain these practices in the long run.
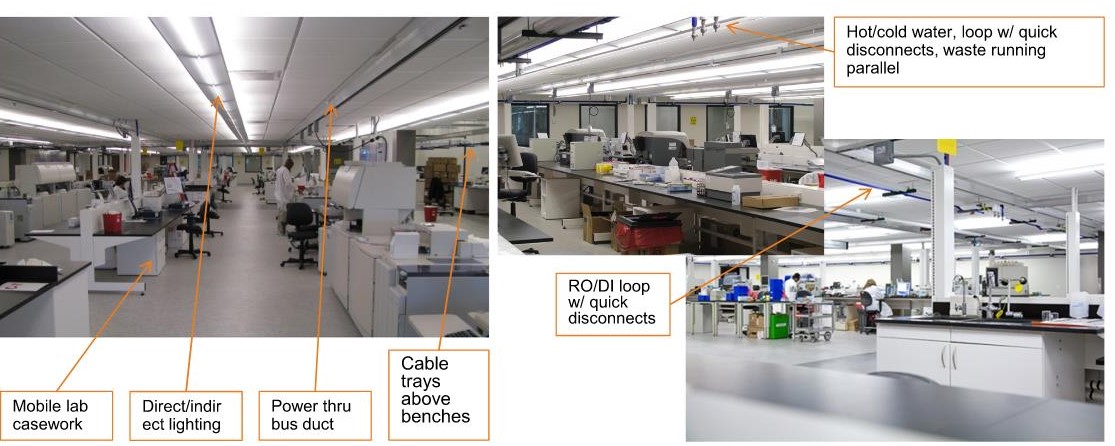
STEP 3 Maximize Flex Labs
Flex lab is defined as follows:
- A lab designed around functions and instruments vs. managerial territories.
- Minimized custom built labs, minimum walls as the modifications are wasteful.
- Maximized large open labs with fully flexible set-up with benches and service utilities.
Flex lab can be designed using the following steps:

- Minimize enclosed labs – easier to build a new room than to remove one.
- Consolidate functions where possible and not counter productive.
- Think linear feet vs. square feet.
- Develop process flow based layout.
- Establish clearly defined circulation & shared support areas.
- Develop a universal bench & grid module.
- Simplify and minimize storage, create visual control of inventory.
- Foster and facilitate lean behavior.
STEP 4 Develop Tracking Matrix with the Lab Owner
The lab layout is optimized once steps 1 thru 3 are complete. The next step involves understanding how new projects are planned, key resources, staffing, equipment and other critical criteria.
An example of iLAB Project Tracking Matrix for a medical device company is as follows:
Key Project Resources
- Lab bench: Flex, with standard lab utilities; Location
- Equipment (Low vs. high value): Location; Maintenance status; Robotics; Critical equipment monitoring; Critical ambient conditions
- Researcher: Certification/training; Position
- Room ambient conditions tracking
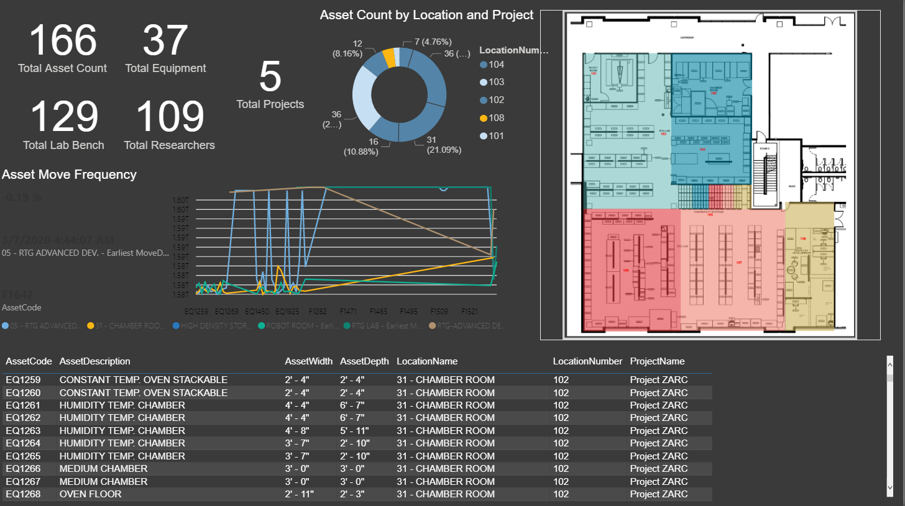
STEP 5 Develop iLAB Dashboard
iLAB dashboard uses business analytics and IIoT technology to create a virtual dashboard that does the following:
- It tracks each matrix separately. For example, all lab benches are tracked separately using RFID technology. The benching tracking page on the dashboard tracks the utilization status of individual bench by linking the benches in the Revit file of the physical lab to the virtual dashboard
- A separate page is created for each matrix to be tracked. Different software platforms are used for tracking individual criteria. If the client already tracks some items such as researcher utilization, we can simply continue with that method.
- Data integration technology is used to combine these and create a dashboard for the lab that can track each matric or all projects as well as allow future project planning.
Each company operates in a unique way and the dashboard will need to be custom developed. An example of dashboard that tracks equipment utilization is below:
Return on Investment (ROI) and Capital Planning
iLAB: Intelligent Lean Lab is fairly affordable thanks to increasing acceptance of lean and flex lab design principles amongst lab managers, optionality in construction solutions to support lean and flex, wide usage of Building Information Management (BIM) based drawing software such as Autodesk Revit and rapid advancements in the automation technology.
Design and construction using lean and flex do not require a cost premium, only a commitment to these operational principles. Once the physical lab is designed and built as such, the development of the dashboard is relatively inexpensive.
While the construction cost of a lab is in $250-350/SF range (interior only), and operational costs are roughly $1,000/SF/year, the cost of development and set-up of the dashboard ranges between $5-20/SF, depending on the project scale.
The financial benefits of iLAB dashboard are very high. A company with iLAB dashboard can plan projects without having to build new labs. They are able to do so because the dashboard gives them a real time information on actual resource utilization. A large pharmaceutical company with multiple locations can now assign a new project to a lab in the west coast that is not fully utilized instead of building additional lab space in the east coast location that is operating at full capacity.
Indirect benefits include ability to plan projects better, inventory management, being nimble in responding to demand fluctuations, avoidance of under and/or over utilization of talent and reliable capital project planning that is based on actual utilization tracking.
Image Credits:
*Please contact IPS for a demo of the iLAB dashboard.

